Solar radiation and electric power generated
Fig. 1 shows, at different
times of day, the incident solar radiation measured by a
radiometer![]() (with a precision of 5%) and the
electric power
(with a precision of 5%) and the
electric power![]() generated in alternate current, on 2 July 2003 - both expressed in W/m2.
generated in alternate current, on 2 July 2003 - both expressed in W/m2.
On that day there were no clouds and only slight unsettled weather for short periods. The curves for insolation and electric energy generated are typical "bell curves", with maximums at 12.00 hours solar time. We can see that the electric power generated follows with a regular pattern the power of the incident radiation, but reduced by roughly a factor of 10.
Fig. 2 shows the incident solar radiation measured by the radiometer and the electric power obtained on a winter day. We can see the shorter duration of the day and the presence of variations due to clouds.
|
|
|
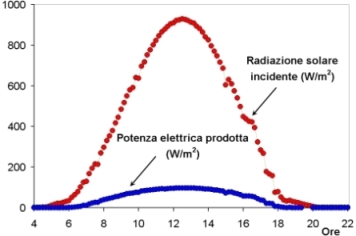
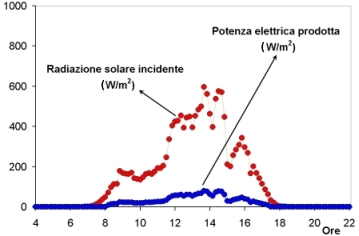
Fig. 3 shows the monthly insolation (in kW/m2) from January 2001 to December 2005, while Fig. 4 shows the a.c. electric energy generated every month (in KWh) in the same period. We can see again that the production of electric energy follows insolation with a regular pattern.
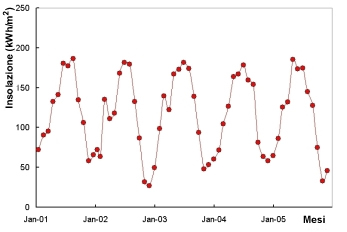 Fig. 3: Monthly incident insolation. |
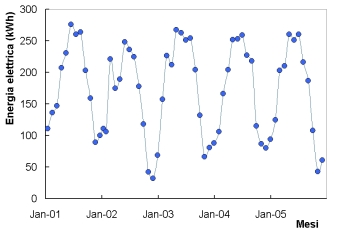 Fig. 4: Electric energy generated monthly. |
If we consider five years,
from 1 January 2001 to 31 December 2005, there was a total insolation of 6990
kWh![]() /m2.
The total electric energy in alternate current generated in the same 5-year
period was 10403 kWh, which corresponds to 150 kWh/m2 per year and to 1112
kWh/year/kWpeak
/m2.
The total electric energy in alternate current generated in the same 5-year
period was 10403 kWh, which corresponds to 150 kWh/m2 per year and to 1112
kWh/year/kWpeak![]() installed. We can note that the overall efficiency E of the system is
installed. We can note that the overall efficiency E of the system is
R=[electric energy generated/m2]/[insolation/m2] = 150/1400 = approx. 10.7%
The table below summarizes the values obtained in the period in question:
| 2001 | 2002 | 2003 | 2004 | 2005 | Annual average | |
| Annual insolation (kWh/m2) | 1440 | 1350 | 1443 | 1389 | 1368 | 1398 |
| Energy generated (kWh/m2) | 157 | 142 | 158 | 148 | 146 | 150 |
| Energy generated (kWh) | 2180 | 1965 | 2185 | 2055 | 2018 | 2080 |
| Efficiency (%) | 10.9 | 10.5 | 10.9 | 10.7 | 10.6 | 10.7 |
The Webweavers: Last modified Wed, 1 Dec 2006 10:40:41 GMT